Research & institutes
Every build is a data set. Treat it like one.
Euler turns the layer images your printer already saves into data you can plot, compare and export, layer by layer.
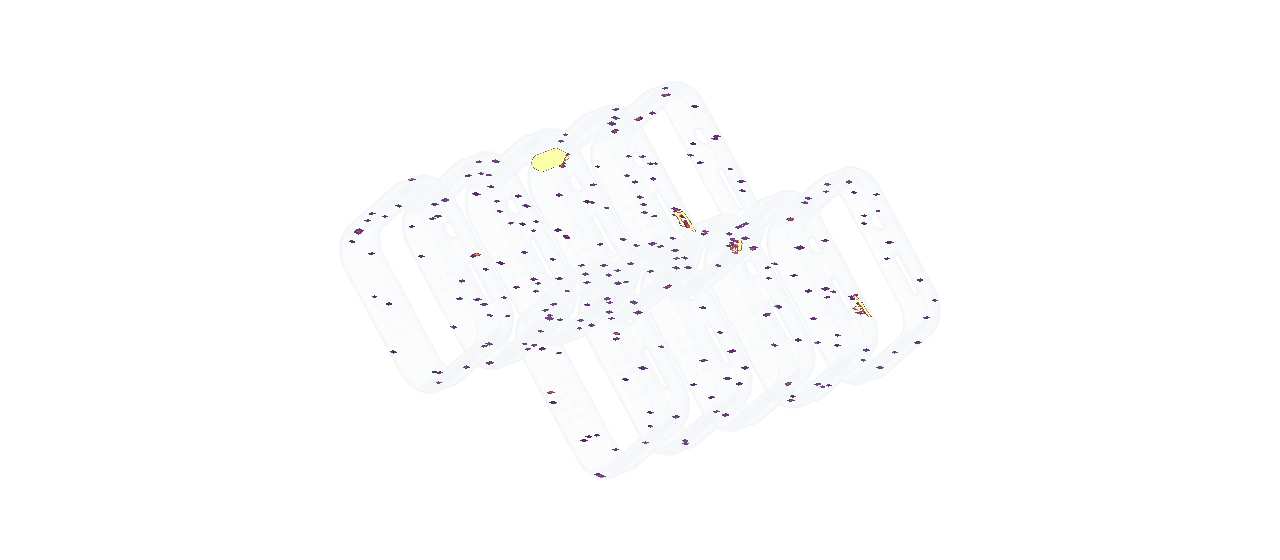
| layer | severity | spatter | streaking |
|---|---|---|---|
| 615 | minor | 7 | 1 |
| 616 | minor | 9 | 1 |
| 617 | critical | 14 | 6 |
| 618 | critical | 13 | 8 |
| 619 | critical | 15 | 8 |
In the lab
Measure the build without building the instrument
Every layer of every build is analyzed from the images your printer already takes. No sensors to buy, no code to write and nothing to calibrate before the first experiment.
On the machines you already have.
Connect a printer and layers arrive as they print, or upload a build you have already finished.
- Obstruction
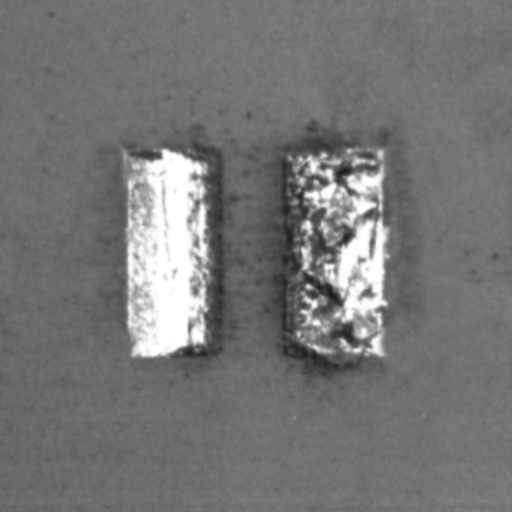
- Warpage
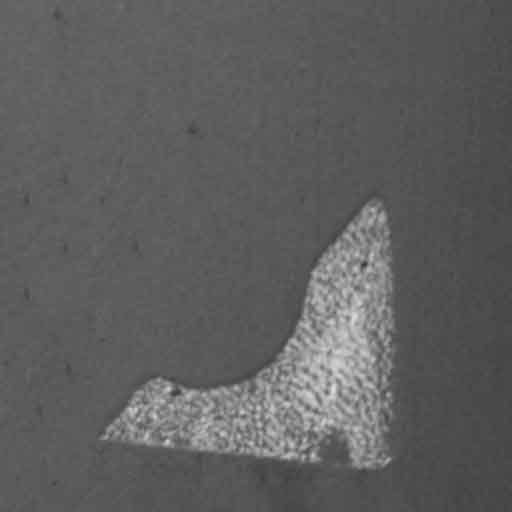
- Pinning
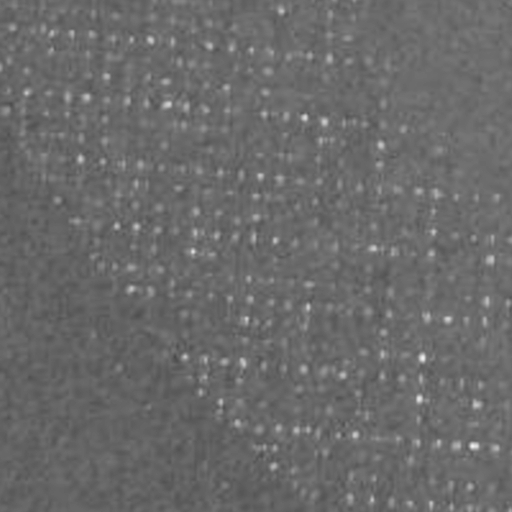
- Spatter
- Smoke
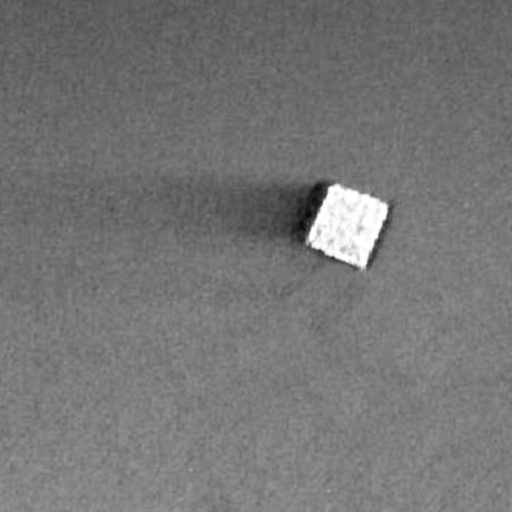
- Streaking
- Hopping
- Hole
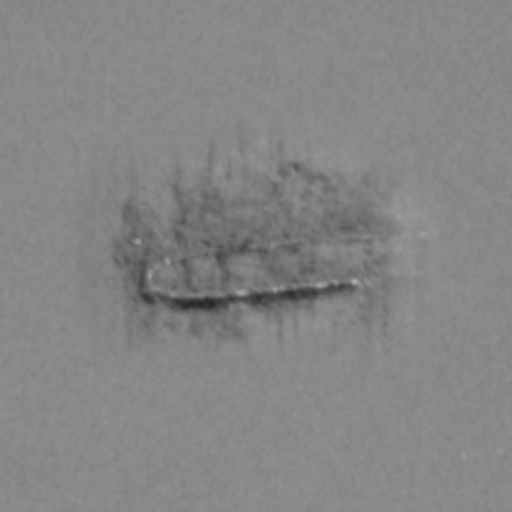
Defects where they happened.
Researchers step through a real build and see the defects on the image, not on a slide.
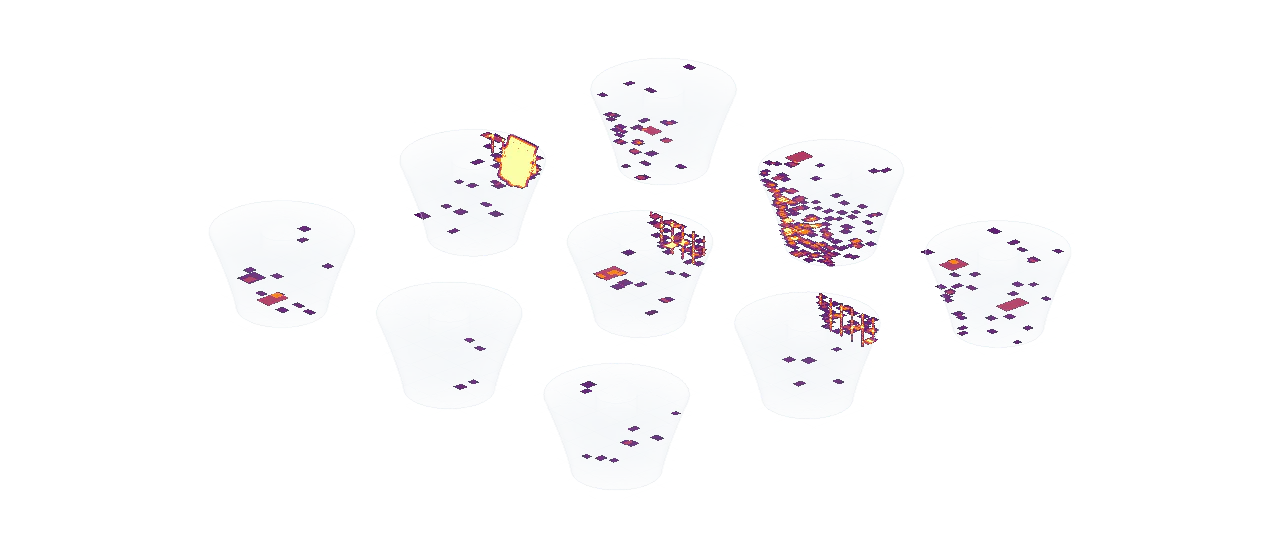
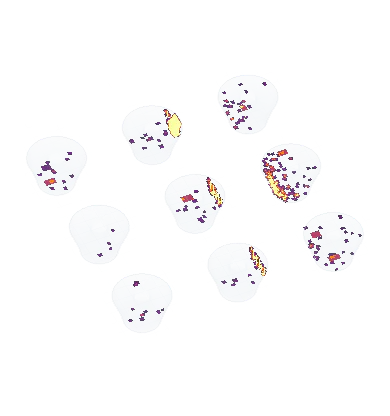
Where defects sit inside the part.
The build in 3D, reconstructed without CAD, so a cluster on one part or one side of the plate is plain to see.
Compare builds
Which parameter set stands out, and why
Compare a group of builds and Euler tells you which ones stand out, and why. Standing out is not always bad. A build can stand out because it has fewer defects.
Five or more builds, one map.
Pick the builds and see what makes one different from the rest.
- Build 07 · Set CSpatter
- Build 09 · Set EWarpage
- Typical8
- Slight0
- Moderate1
- Strong1
- Build 07 · Set CSpatter
- Build 09 · Set EWarpage
- Build 01 · Set A
- Build 02 · Set A
- Build 03 · Set B
- Build 04 · Set B
- Build 05 · Set D
- Build 06 · Set D
- Build 08 · Set C
- Build 10 · Set E
Tagged the way you run the study.
Tag builds by parameter set, material or student project, and see how far each one deviates.
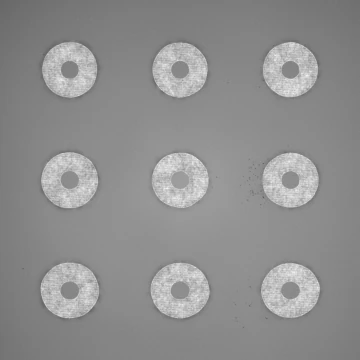
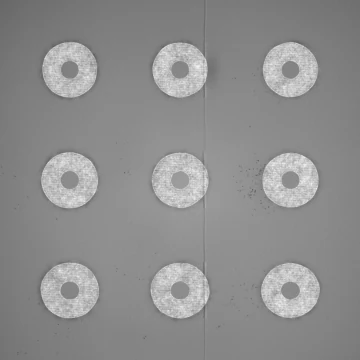
Then look at the layers.
Open two builds on the same layer, side by side, and see the difference for yourself.
Your data, your tools
Chart layer data next to your own logs
Everything Euler records about a build is yours to take out. Line it up with your own machine logs and plot the two together.
Using Euler with an AI assistant- layer-series.csvOne row per layer
- detections-1-1000.csvMarked defects, layers 1–1,000
- detections-1001-1107.csvMarked defects, layers 1,001–1,107
- report.jsonThe build report
Export the data.
Per-layer results and every detection with its position on the plate, as CSV or through the API.
 Read from Euler
Three builds had more spatter per layer than the rest. The turbine bracket had about twice the average.
- Turbine bracket TB-42.1×
- Pump housing PH-61.4×
- Heat exchanger HX-21.2×
EulerOr ask for the chart.
Ask Claude or ChatGPT, and it pulls the data and draws the chart for you.
Customers
What customers say, and what was measured

“Euler is close to perfect in spotting the issues. We have already adopted Euler on all our machines and the vision is to switch completely to automatic QA reporting from machine data.”

 White paper27.8%of all print time in the study went to builds that failed.Many of those were experiments that push the process on purpose.Read the white paper

“There's a lot of things that can go wrong during the process especially for an RTO like DTI where we're really trying to push the boundaries of what's possible.”
FAQ
Before you connect a printer
Start with the free plan
Connect a printer, upload a finished build, and have two of them analyzed on us.
No credit card.